Introducing and interacting with `show_scatter()`
Source:vignettes/show_scatter_interactivity/show_scatter_interactivity.Rmd
show_scatter_interactivity.RmdThe detourr package consists of two very similar
scatterplot displays; there’s a 2D variant and a 3D variant, and both
are produced using the show_scatter() display method. Both
of these have similar capabilities for user interaction, including point
selection, brushing, orbit controls and more. In this vignette, we’ll go
through each of these in turn and describe how they can be used and
configured.
Data
For the following examples, the pdfsense dataset from
the liminal package will be used. (Lee 2021).
Examples
All of the interactivity described in this vignette can be demonstrated in these two examples.
Below is the 2D variant of show_scatter():
set.seed(1)

detour(
  plot_data,
  tour_aes(
    projection = starts_with("PC"),
    colour = Type, label = I(ID)
  )
) |>
  show_scatter(axes = FALSE, alpha = 0.7, size = 0.5)
And the 3D variant:
set.seed(1)

detour(
  plot_data,
  tour_aes(
    projection = starts_with("PC"),
    colour = Type,
    label = c(InFit, Type, ID, pt, x, mu)
  )
) |>
  tour_path(grand_tour(3)) |>
  show_scatter(axes = FALSE, alpha = 0.7, size = 0.5)
Label aesthetics
In the above example, labels are defined within the call to
tour_aes, which contains all of the aesthetic mappings for
the tour. The label aesthetic produces a tooltip which is
shown whenever the mouse is hovered over the data point:
By default, the text in the tooltip will have the format
column_name: value, with each specified column on a new
line. If you want more control over what appears in the tooltip, you can
use the I() function so that the values in the aesthetic
column appear as-is. For example in the 2D scatter
plot example, the ID column is specified as-is by using
tour_aes(label = I(ID)):
When using the I() function for the label aesthetic,
only one column can be specified at a time. To split text in the tooltip
over multiple line, you will need to use <br> as the
line break instead of \n.
Controls
The following is a brief breakdown of the controls found on the left
side of the visual. Note that the icon for the currently selected
control will be highligted blue; otherwise it will be black. When you
hover over the icons in the show_scatter() widget,
alternative text will be shown.
| Control | Icon | Description |
|---|---|---|
| Orbit |  |
When the show_scatter() widget is generated, orbit
controls will be enabled by default. This allows click and drag to
rotate the visual, and scrolling/pinching to zoom. Note that orbit
controls for the 2D variant work best if dragging from left to right,
not up and down. Also note that the icon for the currently selected
control will be highligted blue; otherwise it will be black. |
| Pan |  |
The pan control also allows scrolling to zoom, and click and drag to pan. |
| Box Selection |  |
The selection control allows for transitory box selection by
brushing. Holding the shift key will allow for persistent
selection, and points outside of the selection will be indicated by
increased transparency. There is currently a limitation where only
visible points can be selected. If a point is completely obscured by
other points, it will not be selected. |
| Brush |  |
The brush button will apply the current colour to the selected points. |
| Colour Selector | 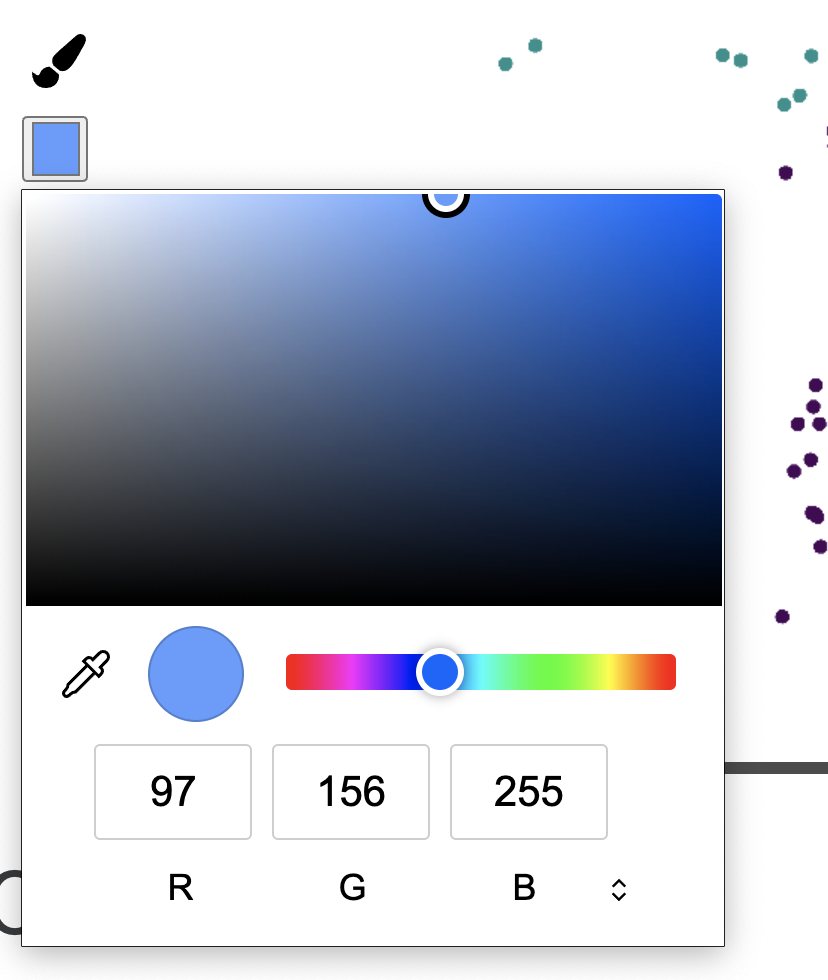 |
The colour selector will look slightly different depending on the browser being used. When the colour selection is changed, the selected points will be updated immediately. |
Below is an example of using the box selection control, brush control, and colour selector together:
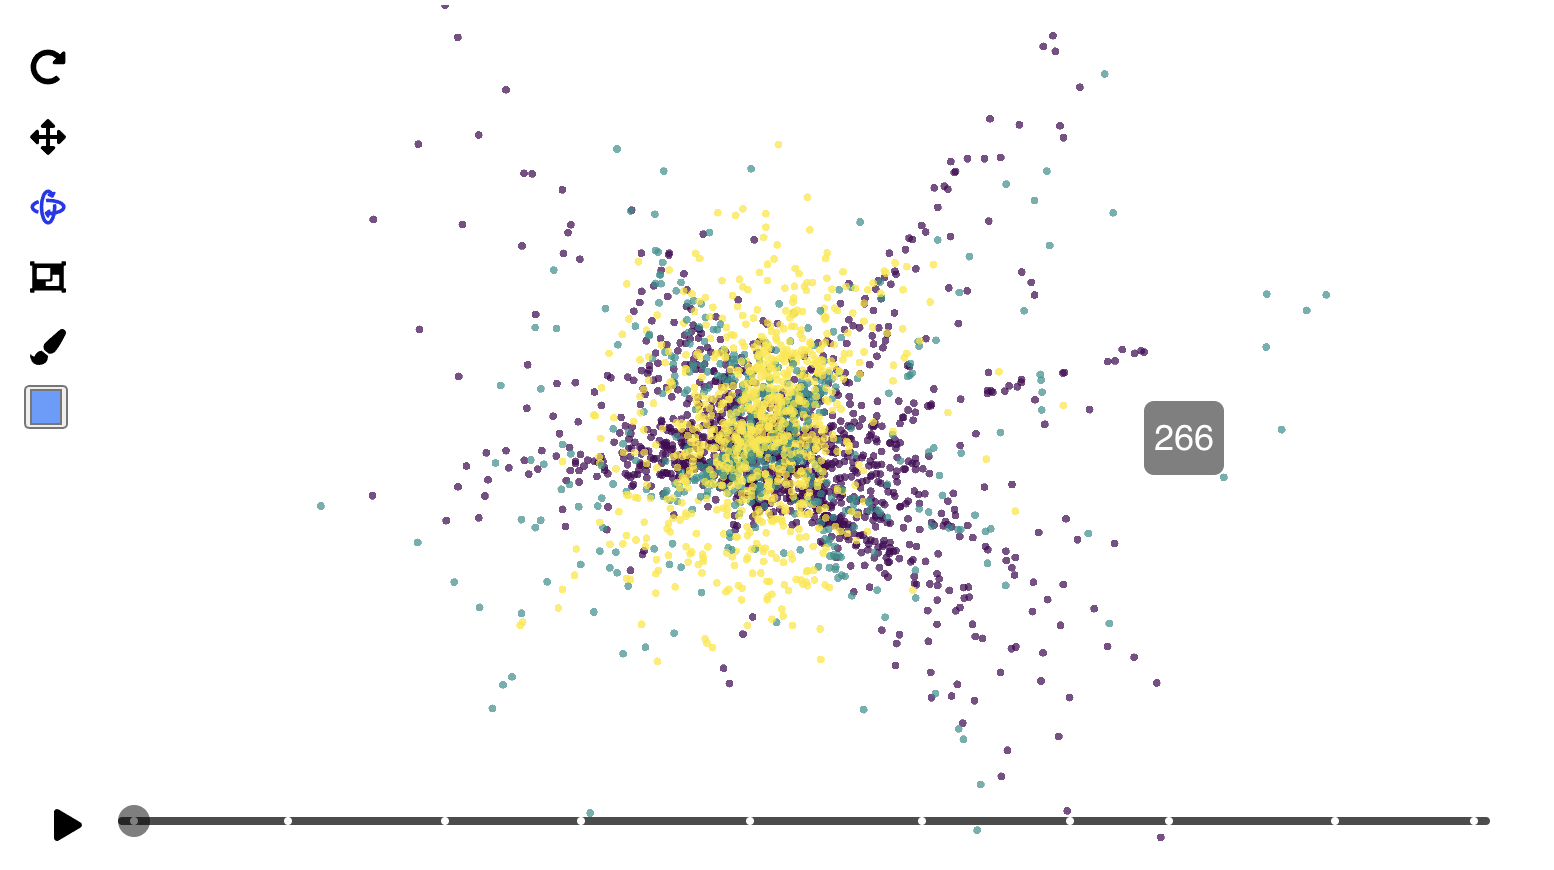
Timeline controls
The timeline at the bottom of the widget controls play and pause, and allows for scrubbing to a specific point in the tour. The timeline can also be used to jump to a specific basis by clicking on any of the white basis markers, and hovering the mouse over the basis markers will display the index of that basis.
This funcionality is shown below:
Conclusion
In this vignette we’ve demonstrated the interactivity of the
show_scatter() display method in the detourr
package. If you have any issues or suggestions, please open an issue on
github.